Graffitis in Paris
Visualising crowdsourced data of reported graffitis, posters and stickers in Paris
April 28, 2022
Urban graffitis are interesting markers of a city, as their representation within the general public have fluctuated from vandalism to a respectable art form. Street artist Banksy sold his piece “Girl with Ballon” for $1.37 million at a Sotheby’s auction in 2018. Who would have imagined 20 or 30 years ago that graffitis would sell for millions of dollars?
Even if street art is nowadays welcome, and cities around the world have adapted regulations to authorise graffitis in dedicated areas, illegal graffitis remain common, be it for the anti-systemic essence of the art form, or simply because of lack of space.
In Paris, garbage collectors clean nearly 650m² worth of tags and graffitis every day. The City of Paris has recently reinforced its measures to fight against illegal graffitis, within a more general mission of maintaining the city’s aesthetics. A “Beauty Manifest” for Paris was published in early 2022, with a series of ambitions around maintenance and cleaning, including a doubled budget for “dégraffitage” compared to that of 2021. This comes partly in response to a dissatisfaction of Parisians regarding cleanliness and the general state of public space, which has been voiced on social media with the #SaccageParis movement. Posted pictures of broken benches, rubbish on the streets and potholes (to name a few) have been proliferating since March 2021.
To explore this topic a bit more, I used the public dataset of reports uploaded on the City’s “Dans ma rue” app.
Which areas have the most reported graffitis, posters and stickers?
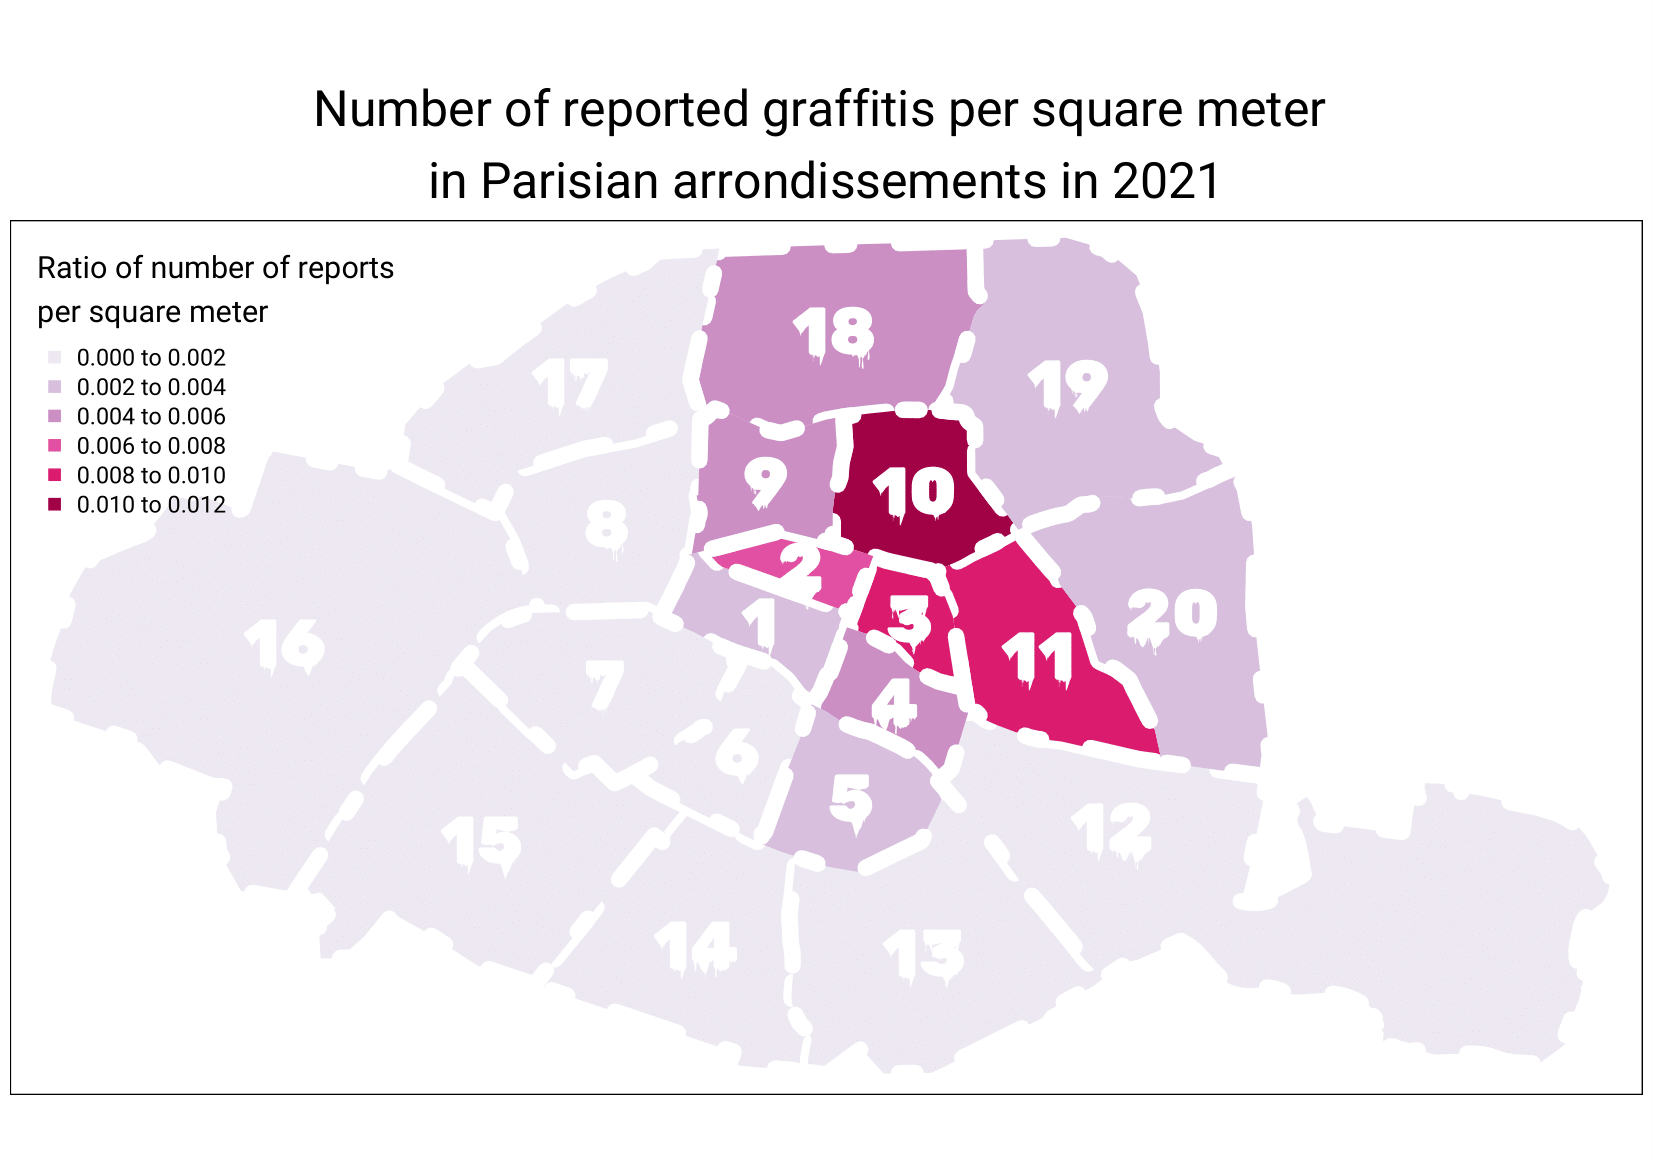
The arrondissements with the highest ratio of graffitis per square metre are generally located in the north east of Paris, with the 10th hosting the most reported graffitis relative to its surface. This comes with little surprise as many graffiti spots (and recommended tours) are located in these arrondissements.
The only arrondissement on the Rive Gauche that has a somewhat high ratio is the 5th. Interestingly, this echoes with the recent news of two famous graffiti writers who have been taken to court for producing hundreds of graffitis, with a majority in that same arrondissement.
What are the most common types of surfaces used?
The majority of reported graffitis, posters or stickers are on walls or flat surfaces such as on bridges. Metal shutters often used on front stores are also a quite common type of location with over 23,000 reported occurrences.
When are most reports made?
While the proportions of types of locations remain stable throughout the year, some fluctuations in general number of reports can be detected. The most noticeable trend is that less reports were made in the winter months. This can potentially be explained as graffing behaviours can be influenced by weather conditions and amount of daylight. However, it is important to remember the nature of the data, which is of reports rather than graffiti production per se. In that sense, seasonality reflects also that of the behaviours of people who make the reports. For example, the fluctuation may also reveal that people make more reports as they spend more time outside without necessarily it being the case of there being more graffitis.
Within the winter months, there were more reports made in the end of 2021 rather than the beginning. A potential factor could be related to the lockdown that was put in place in Paris from January to June to deal with the Covid crisis. This may have impacted both graffiti production and reporting in early 2021 as activities overall were restricted at night.
The months with the highest number of reports are April and September, which does not reveal a particular pattern. One common feature to both of these times could be that they are situated outside of school holidays, which would imply higher presence of local residents.
Overall, the data confirms what the #SaccageParis movement expresses: graffitis bother many Parisians and they seem to be seen more in certain areas. With over 230 000 reports made just in 2021, half of which being of graffitis on walls and bridges, it is clear that the debate around street art is not settled. The question is, will regulations and efforts to clean the walls of Paris be enough to tackle an art form that is by essence political and in which, in the words of Sheperd Fairey (author of the "Obey" signature), "the very act of doing it is an act of defiance"?